
🍟Food Distribution - A Misunderstood Story🥓


(May 22, 2020) - Foodservice is an integral part of a $300B value chain, supplying restaurants, hospitality and retail industries with food & materials supplies. The space is fragmented with ~15,000 distributors, however the top 3 players (Sysco, US Foods and Performance Food Group, “Big 3”) own ~30% of the market. Since March, the stock market has hammered publicly traded food distributors (rightly so), but as the dust settles it’s hard to argue upside doesn’t exist to their current share price.
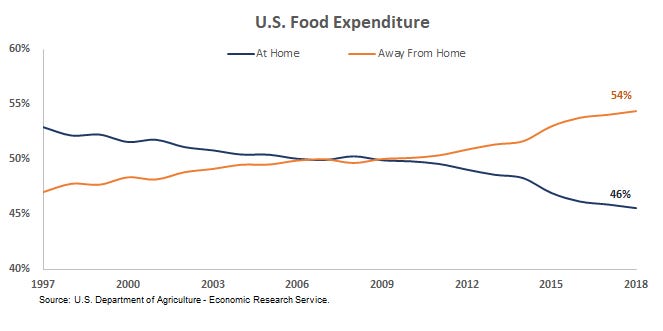
COVID-19 has dramatically shifted the dining habits of Americans. The nation has immediately altered consumption channels from dine-out to dine-in, reversing a secular trend of consuming meals away from home.
This shift directly affects food distributors, who are focused on the away-from-home channels across restaurants, hospitality, and retail end markets. The year-over-year growth metrics compared to last year aren’t pretty, and open questions remain on the permanence of work from home, outlook of the travel & leisure market, and dining utilization once shelter-in-place is lifted.
Sounds terrible? I believe the market is over-hesitating on the perceived softness in core end markets, high financial leverage, and should take an alternative view towards valuation. In particular, I like Sysco ($SYY), the largest market participant with liquidity of $5.5B, positioning it well to not only weather the storm, but also to take market share in an industry characterized as favoring scale (capital intensive, high inventory turnover, low operating leverage with low margin).
Core End Markets

We focus on the restaurant end market, as 1) it comprises of two-thirds of the Big 3’s customer mix, and 2) there is a historical ~70% correlation between restaurant sales and revenue (adjusting for other channels). The restaurant industry is certainly battered but not broken, and certain sub-sectors are quickly recovering. From MillerPulse data, overall industry SSS (Same Store Sales Growth) has recovered to a ~20% decrease versus the prior year, with Quick Service (including Fast Casual) heavily influencing the increase.
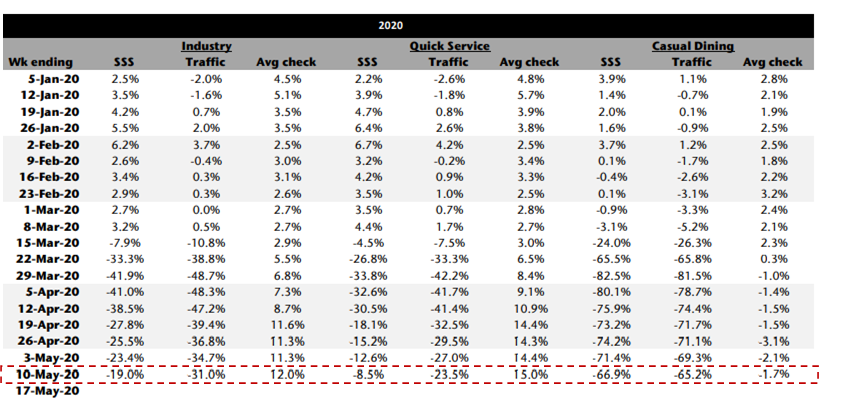
The fast casual (example: Chipotle) and quick service (McDonalds) sub-sectors have successful diversified their revenue streams towards curbside and delivery channels. The Fed has also provided liquidity to franchises and consumers, with a meaningful portion of consumer checks received spent on these sub-sectors given the value and accessibility of the services. The market has clearly appreciated the resilience of these companies and rewarded these companies with higher stock price and trading multiples.
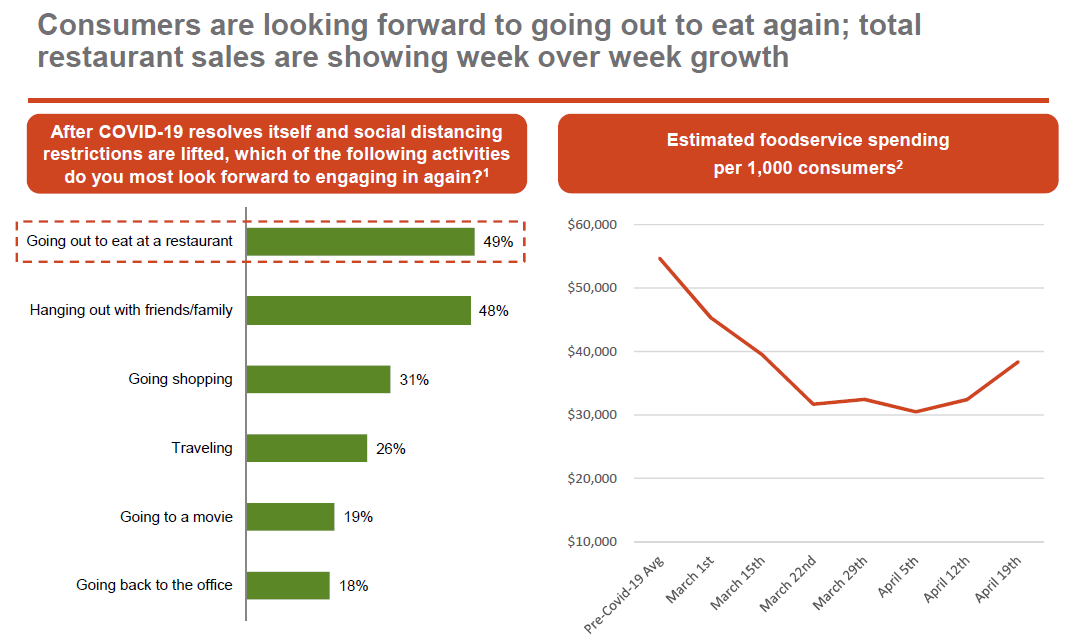
Casual dining (Olive Garden) lags for obvious reasons, however silver linings: Off-premise sales have increased ~3x versus pre-COVID-19 levels and pent-up demand as states reopen. From Technomic Foodservice Impact Monitor:
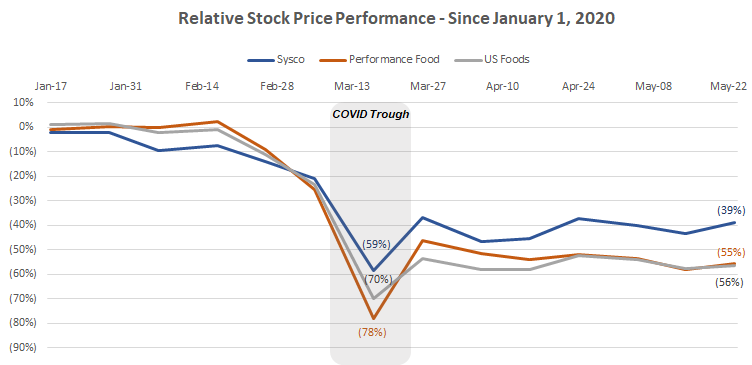
So what does this all mean for stock prices? And how does this compare to the Big 3?
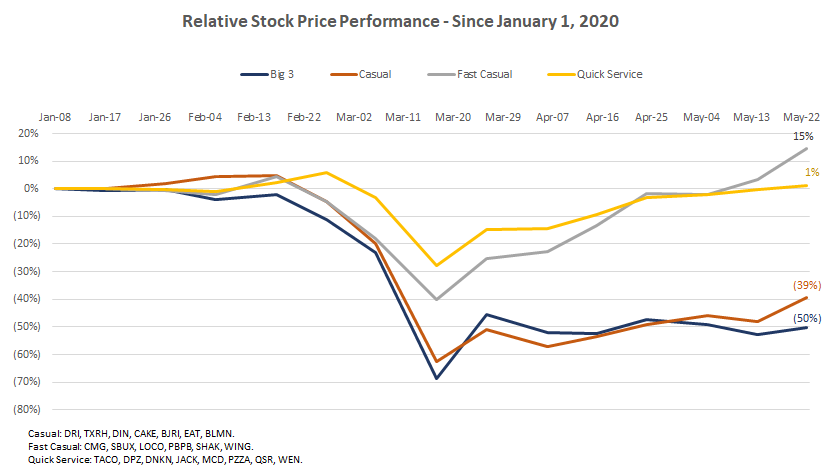
The market is clearly appreciating the resilience of Fast Casual & Quick Service, but the Big 3 lag even the Casual sector! This is akin to semiconductor companies being left behind as PC companies recovered post dotcom bubble.
Key questions that explain the difference are: 1) What percentage of the customer mix is chain restaurants versus independent, and 2) How concentrated are revenues in the better performing sub-sectors?
For question 1, independent restaurants have been more adversely affected compared to chain restaurants (access to capital, online presence, brand, etc.). Independents represent ~50% of the restaurant channel customer mix, and reliable data is sparse given the local & fragmented nature of that end market.
However, management for the Big 3 have all publicly stated on their recent May earnings calls that independents have performed in-line with chain restaurants.
Those [independent] customers of ours that were, in fact, doing takeout and delivery are getting better at it…And we’ve seen an increase in those restaurants that were up and running throughout the entire crisis sequentially week-over-week, and they’re ordering more from us as a result.
What we’ve also seen is each week in April, more of our customers were getting back into business. So for some of them at the very beginning of the social distancing, temporarily closed shop. We’re seeing about a 10% week-over-week increase in the number of unique customers that we are serving.
- Kevin Hourican, CEO - CQ1 2020 Sysco Earnings Call
During the most of the last six weeks, there was minimal difference between chains and independent restaurants in terms of volume declines and the speed with which those volumes declined. There was a little bit more resilience from the QSR sector, but generally, both were very much in line with each other.
- Pietro Satriano, CEO - CQ1 2020 US Foods Earnings Call
Our salespeople are keeping constant contact with those customers as best they can, and we're not hearing them say that there's going to be a huge amount of closings or not reopening. From the trough to today, they’re about the same, the independent and the chain are very similar.
- George Holm, CEO CQ1 2020 Performance Food Group Earnings Call
For question 2, we know the Big 3 supplies large chains e.g. Sysco supplies Wendy’s, Chipotle, etc. The largest customer of the Big 3 is less than 10% of annual sales, so a very diversified customer set. We also know pre-COVID, there was a trend for some distributors towards independent customers as they possessed higher margins. Again, there is no publicly available data on customer concentration.
I gravitate towards data-driven versus anecdotal-driven conclusions, but in the absence of other sources of data and taking a balanced view (hah!) between the positive: management’s commentary, quick service / fast casual recovery, and the negative: long road ahead for casual, the truth likely sits somewhere in the middle. The Big 3 have also stated total case volume (distribution industry standard unit of sale) has been recovering week-over-week, which is encouraging. In the absence of a COVID double dip, the industry will continue to recover and the surviving independents will be beneficiaries of reopening states (people craving a unique experience vs. Applebees for their first meal back).
Leverage & Financial Profile

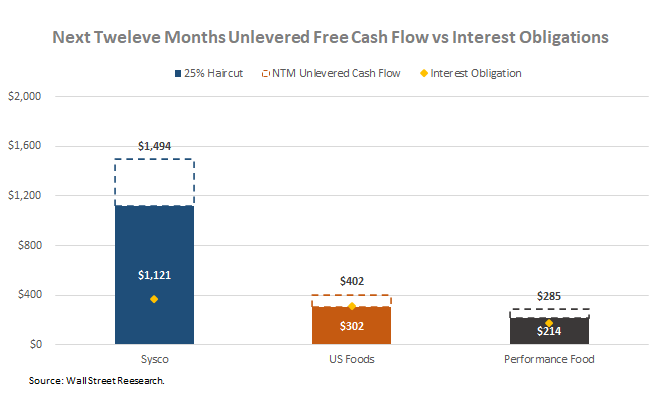
While the Big 3’s net leverage has increased to historical highs through new debt issuances and revolver drawdowns (and deteriorating TTM EBITDA), liquidity has also increased dramatically to fund the businesses through 2021. Each company also generates enough free cash flow to service the now larger interest payments, even in light of the current environment.
Digging deeper, I like SYY’s recent bond issuance. The bonds are callable at par, allowing SYY to de-lever without expensive pre-payment penalties as cash flow improves. The new issuance is also unsecured by subsidiaries. Contrast this to that US Foods and Performance Food Groups much more onerously structured notes, SYY has both an operating and financial flexibility advantage.
Each company has adequate cashflow to cover interest payments, even in the face of stretched account receivables and rising bad debt expense. Analyzing next twelve month’s free cash flow and applying a 25% haircut for cushion, SYY is the best positioned to remain relatively financially unconstrained versus their key competitors.
If leverage is manageable, what about the business structure?
The market underappreciates the low operating leverage structure of the Big 3. Food distributors purchase perishable and non-perishable products at wholesale cost. They then sell to food operators at a typical 15-20% markup depending on the product. The markup covers the distributor’s cost to store and distribute, as well as corporate overhead and macro risk e.g. inflation. The lead time isn’t very long, therefore there isn’t a massive inventory hold risk. If revenues decrease, the operating costs can correspondingly decrease ~85%. What this means is if revenues go to zero, only 15% of expenses are unavoidable, and in fact can be further reduced through cash flow preservation measures.
Running back-of-the-envelope math, if revenues decrease by 75%, Sysco, US Foods and Performance Food Group can continue operating for 33, 18 and 20 months, respectively (of course financial covenants would be tripped far before then).
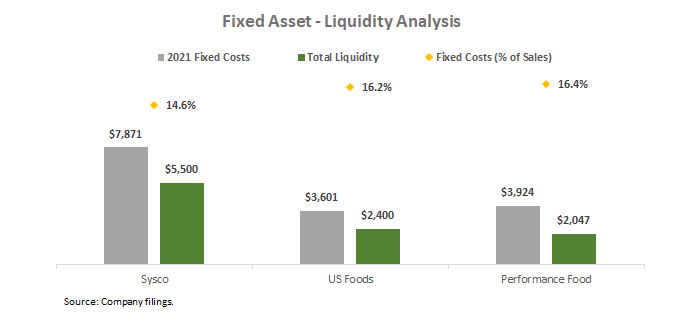
Compare this to a high fixed asset industry with large ongoing obligations e.g. casino gaming industry, where high rent, maintenance, employee salaries still need to be paid even if the properties are closed and days liquidity are low, the financial structure of the Big 3 starts to make a lot more sense.
Valuation

The market is pricing food distributors at valuation levels that assume a top-line & margin recovery by June 2022.
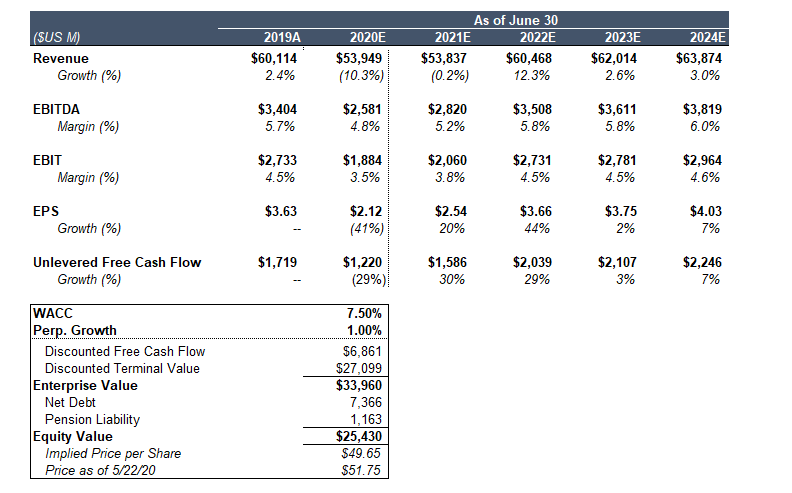
Using our pick, SYY, the enterprise value (value of operations irrespective of capital structure) is currently valued at ~$34B. Reverse engineering this figure implies that by fiscal year 2022 (they report on a June 30 basis), revenue recovers 2019 levels a full 3 years later. Thereafter, the valuation implies a normalized historical growth & margin profile of ~3% top-line and ~4.5% operating margins.
Illustration & quick notes on methodology below:
Now we know the estimates implied in the SYY stock price. What is more interesting is if we take a slightly alternative approach to valuation, and calculate where SYY’s future stock price could be in 1 year based on a few scenarios on how the distribution landscape recovers.
Assuming we fast-forward 1 year (June 30, 2021), and SYY’s business outlook for the following year (2022) has returned to pre-COVID levels, the stock price could be $65 – $70/share, implying a 25% - 35% upside to where we are today assuming SYY trades at its historical ~19x forward P/E multiple.
What set of assumptions get us there?
Base case – Revenue and margins recover by mid-2022 to 2019 levels and the dine-out outlook is stable. SSS is +10% for fast casual & QSR, and -10% for casual, with casual being permanently affected with lower utilization per table. Channel shifts come to fruition e.g. delivery-only concepts, groceries.
Bull – Full recovery by mid-2021 to pre-COVID levels, dine-out is robust and independent restaurants thrive on pent-up demand. SYY gains meaningful market share, driven by smaller competitors going OOB during 2020 (3-5% share growth implies $9 - 15B increase in top line). Margins recover to pre-COVID levels.
Bear – Distribution ecosystem is long-term impacted by a perma-negative view toward dine-out. The addressable market for old-world distributors shrinks as other nimble players capture other channels in 2021. SYY continues to position itself for a restaurant recovery.
Based on our view of what the future world looks like, we can pick a corresponding stock price.
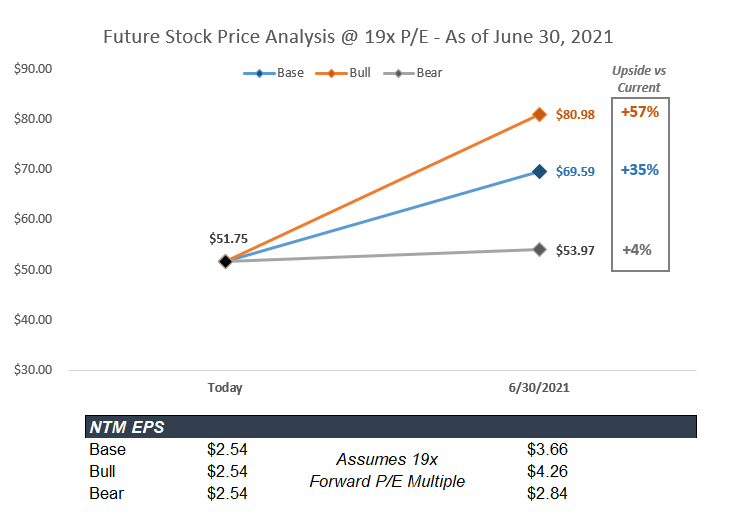
Even assuming the worst case, with 2022 EPS below 2019 levels, the analysis implies the stock price has bottomed. Remember, only one quarter ago, SYY was trading at $85 a share. It doesn’t seem so farfetched that in a year, the restaurant end markets continue improving, SYY uses a portion of the excess cash flow to de-leverage, and within this time period market realizes this and drives positive momentum.
Have thoughts? Let me know what you think and leave a comment!